
Dating pool data guide
How Age, Height, Income, and Location Change Your Dating Pool
A dating pool estimate is not controlled by one magic filter. It changes as your age range, measurable requirements, and search area change. This guide shows what each factor does, how the factors combine, and how to test one trade-off at a time.
The short answer
Age, height, income, and location can all narrow or widen a dating pool estimate. Their effect is relative to your starting settings: a small change to the strongest constraint may matter more than a large change to a weak preference.
The clearest way to understand your result is to change one variable while holding the others steady. That turns a vague feeling that your standards are “too strict” into a testable question: which condition changes the planning range, and is that condition genuinely essential?
You can run that one-variable comparison in the dating standards calculator and then use this guide to interpret the trade-offs.
The four measurable factors to inspect first
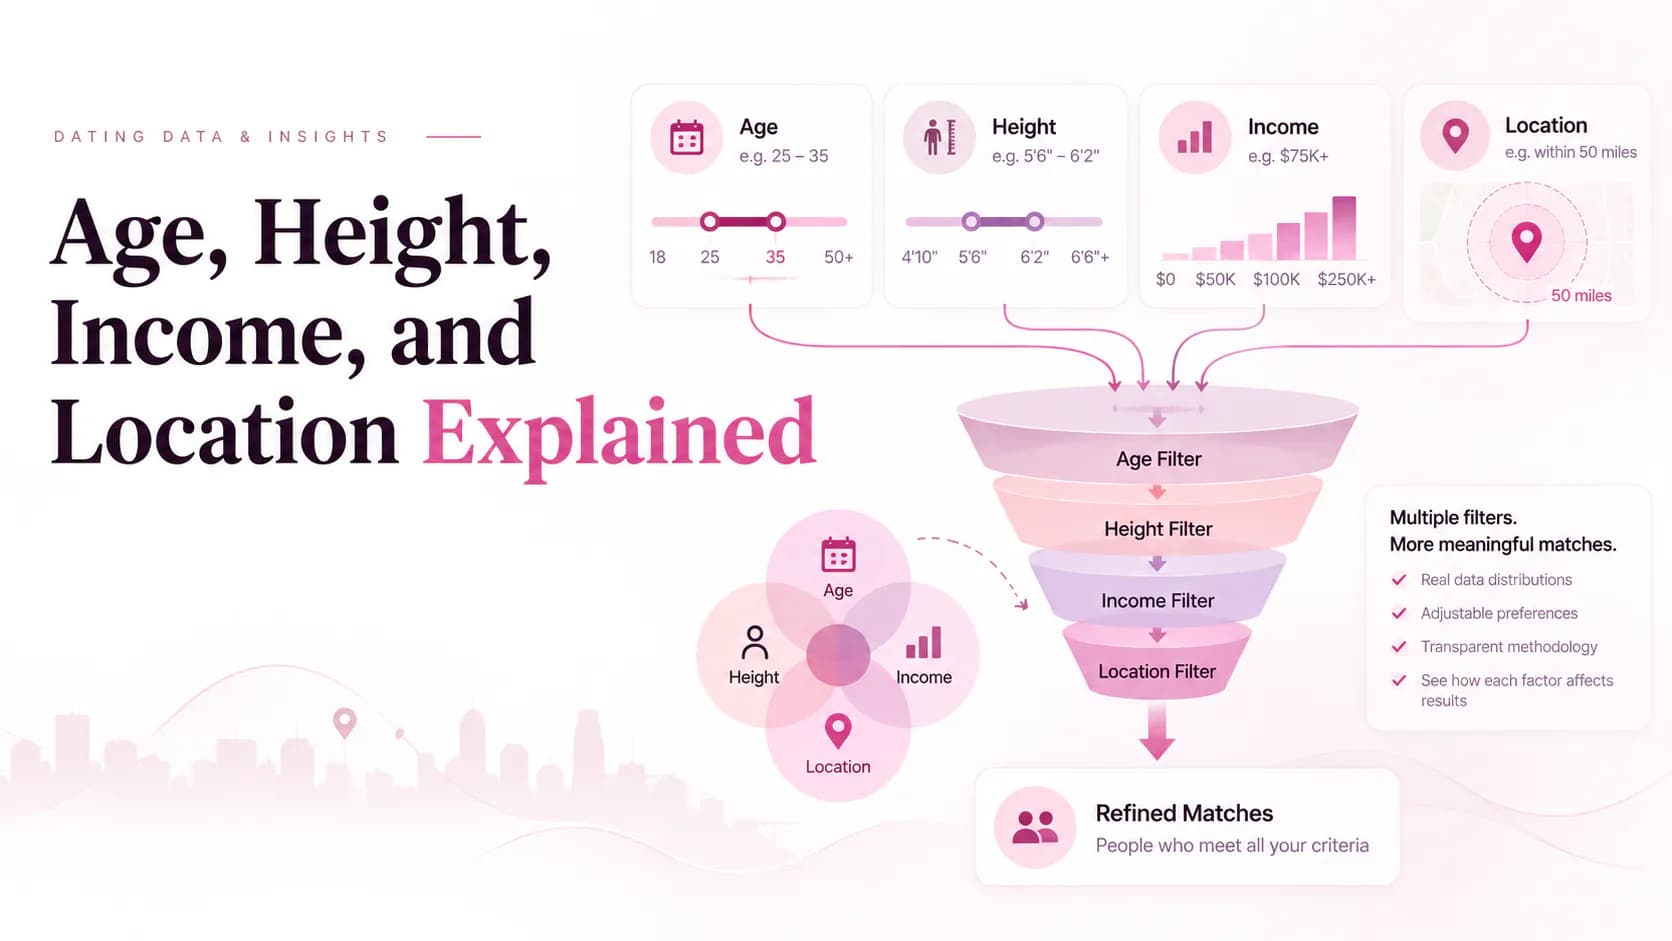
These factors do different jobs in the model. Age and height describe thresholds, income is translated through country data, and location changes the market boundary. Treating all four as the same kind of percentage creates confusion.
Age range
The model starts with the width of the selected age range.
A 25–35 range covers 11 inclusive years. A 25–45 range covers 21. Holding everything else fixed, the wider range has more room before other restrictions are applied.
Height threshold
A higher minimum height is treated as a progressively narrower measurable condition.
The current model references 160 cm and reduces the height factor by 0.016 for each centimetre above that reference, with a floor to avoid false precision.
Income threshold
Income is translated into a country-specific estimated percentile.
The amount is mapped to published income bands for supported countries. The percentile is then counted once, so the amount and its percentile do not become two separate filters.
Location and search area
Location changes the reference market and the practical reach of the search.
City, metro, and country ranges use different market factors. A larger range can raise the planning estimate while also making access and travel more demanding.
How the factors combine without pretending to be exact science
A simple model might multiply four population percentages as though age, income, height, and location were independent. That can create a very precise-looking number from assumptions that are not actually independent.
The current planning model uses a different sequence. It starts with a country-level reference share, applies visible measured factors, weights dealbreakers more heavily than lighter preferences, and dampens later overlapping restrictions. The output is then shown as a range when a supported national estimate is available.
Step 1
Reference population
Step 2
Age and market
Step 3
Income and height
Step 4
Overlap dampening
Step 5
Planning range
Why this matters
A result such as 4%–7% is a deliberately broad planning range. It is more honest than reporting a point estimate that implies the data can observe every joint condition in a real city.
Use sensitivity testing to find the real constraint
Sensitivity testing means changing one input, recording the result, and returning to the same baseline before testing the next input. The goal is not to maximize a percentage. It is to see which assumptions deserve a conversation with yourself.
| Factor | Baseline | One change | What to inspect |
|---|---|---|---|
| Age | 25–35 | 25–4511 years → 21 years of selected range | Would I genuinely date across the wider age range? |
| Height | 170 cm minimum | 180 cm minimum0.84 → 0.68 height factor | Is the threshold essential, or a proxy for another trait? |
| Income | Around the 50th percentile | Around the 90th percentile0.50 → 0.10 income factor | What need is the income requirement meant to protect? |
| Location | City | Metro or countryA wider market factor before overlap dampening | Would I actually travel or relocate for this wider pool? |
Run the tests in the same order every time. If location changes the result dramatically but you would never travel farther, the wider result is useful as a comparison, not as your practical search setting. If income changes the range dramatically, ask whether the threshold protects a real financial need or stands in for security, ambition, or lifestyle compatibility.
A worked example: changing one condition at a time
Imagine a person starts with a supported country, a city search, ages 25–35, no income requirement, and no height requirement. That baseline is not “correct”; it simply gives the comparison a stable starting point.
Test age
Move from 25–35 to 25–45. The selected range becomes wider, so the age factor rises.
Test height
Add a 180 cm minimum while restoring the baseline age range. The height factor becomes a visible restriction.
Test income
Add a threshold near the 90th percentile. The model uses the country income position once and displays it in the impact list.
Test location
Keep the standards fixed and compare City, Metro, and Country. The estimate changes with reach, while practical access becomes the key caveat.
After the four tests, restore the baseline and combine only the conditions you would actually use. This prevents a common mistake: interpreting the result of four simultaneous changes as proof that one particular standard is responsible.
What this framework cannot tell you
A planning factor is not a person-level probability
The model can make trade-offs visible. It cannot observe who is actively dating, who would respond to you, who lives close enough to meet, or whether a relationship would be healthy.
- The country baseline is not a city-level joint census count.
- A relationship-status category is a demographic proxy, not proof of availability.
- Lifestyle settings use stated compatibility weights rather than invented local prevalence percentages.
- The range does not model attraction, mutual interest, platform activity, or relationship success.
- A broader result is useful only when your behavior, distance, and timeline make it actionable.
For the location-specific trade-off, read our guide to city, metro, and country search areas. For the difference between demographic overlap and real compatibility, read what the number misses.
Turn the model into a useful decision
Start with the standards that protect your safety and core relationship goals. Then sensitivity-test age, income, height, and distance one at a time. Keep the changes you can explain and act on; question the ones that only make a number look better.
Test one variable at a timeDating pool factor FAQs
Which factor changes a dating pool the most?
There is no universal winner. The effect depends on the starting range, country, city, and whether the condition is treated as a dealbreaker or a lighter preference. A narrow age range, high income threshold, tall height threshold, or small search area can each become the strongest constraint in a different scenario.
Does the model multiply age, height, income, and location percentages directly?
No. The model uses visible factors, priority weights, and overlap dampening. This avoids presenting a simple product of independent percentages as an exact joint-population statistic.
Is the result a real percentage of people I will meet?
No. It is a broad planning range or relative breadth score. It does not measure active dating, mutual attraction, exposure, compatibility, or relationship success.
How should I test which standard is narrowing my pool?
Keep every other setting fixed, change one condition, record the result, and repeat. Test age, height, income, and location separately before changing several conditions together.
Does a wider dating pool mean I should lower my standards?
No. Protect standards tied to safety, respect, relationship intent, and essential life goals. Use sensitivity testing to identify flexible preferences and weak proxies that deserve a closer look.
Sources and model notes
This guide describes the model currently used by the site and separates measured demographic inputs from editorial planning weights. Country income bands and baseline population sources are listed in the calculator’s methodology page.
Public data can support part of this question. The U.S. Census Bureau’s 2024 American Community Survey Public Use Microdata Sample (ACS PUMS) documents person-level variables such as age (AGEP), sex (SEX), marital status (MAR), income (PINCP or WAGP), geography (PUMA), and the survey weight (PWGTP). That makes a weighted, transparent analysis of several demographic conditions in the same record possible, within the geographic detail and limits of the survey.
Height comes from a different official source. CDC/NCHS measured-body data report adult height distributions; its current FastStats summary lists mean height for adults 20 and older as 68.9 inches for men and 63.5 inches for women for August 2021–August 2023. Those measurements provide useful context for a height threshold, but they are not linked to the ACS people records.
What that means for this article
We can cite real distributions and use ACS PUMS to explain which variables can be analyzed together. We cannot combine ACS and CDC/NHANES into a claimed city-level percentage of people who simultaneously meet an age, height, income, relationship-status, and location condition. The examples above therefore remain sensitivity tests inside a planning model, not a complete joint microdata estimate.
- U.S. Census Bureau: ACS PUMS documentation — user guides, data dictionaries, weights, and accuracy notes.
- U.S. Census Bureau: 2024 ACS 1-year PUMS variables — definitions for the variables named above.
- CDC/NCHS FastStats: Body Measurements — adult height summary and links to the underlying tables.
- CDC/NCHS: Anthropometric Reference Data, August 2021–August 2023 — measured height percentiles by age and sex.
The examples above are sensitivity-test examples. They are not claims that a particular age, height, income, or location combination occurs at the same rate in every city or country.
Read the full methodology and data sourcesBottom line
Age, height, income, and location are useful because they make trade-offs visible. They are not useful when a model output is treated as a verdict about your standards or your future. Change one condition, understand why the range moves, and keep the decision connected to the people and places you can realistically meet.