
What Percent of Women Meet Your Standards?
Estimate the share of U.S. women who match your measurable preferences, then learn why that percentage is not the same as your chance of finding a compatible partner.
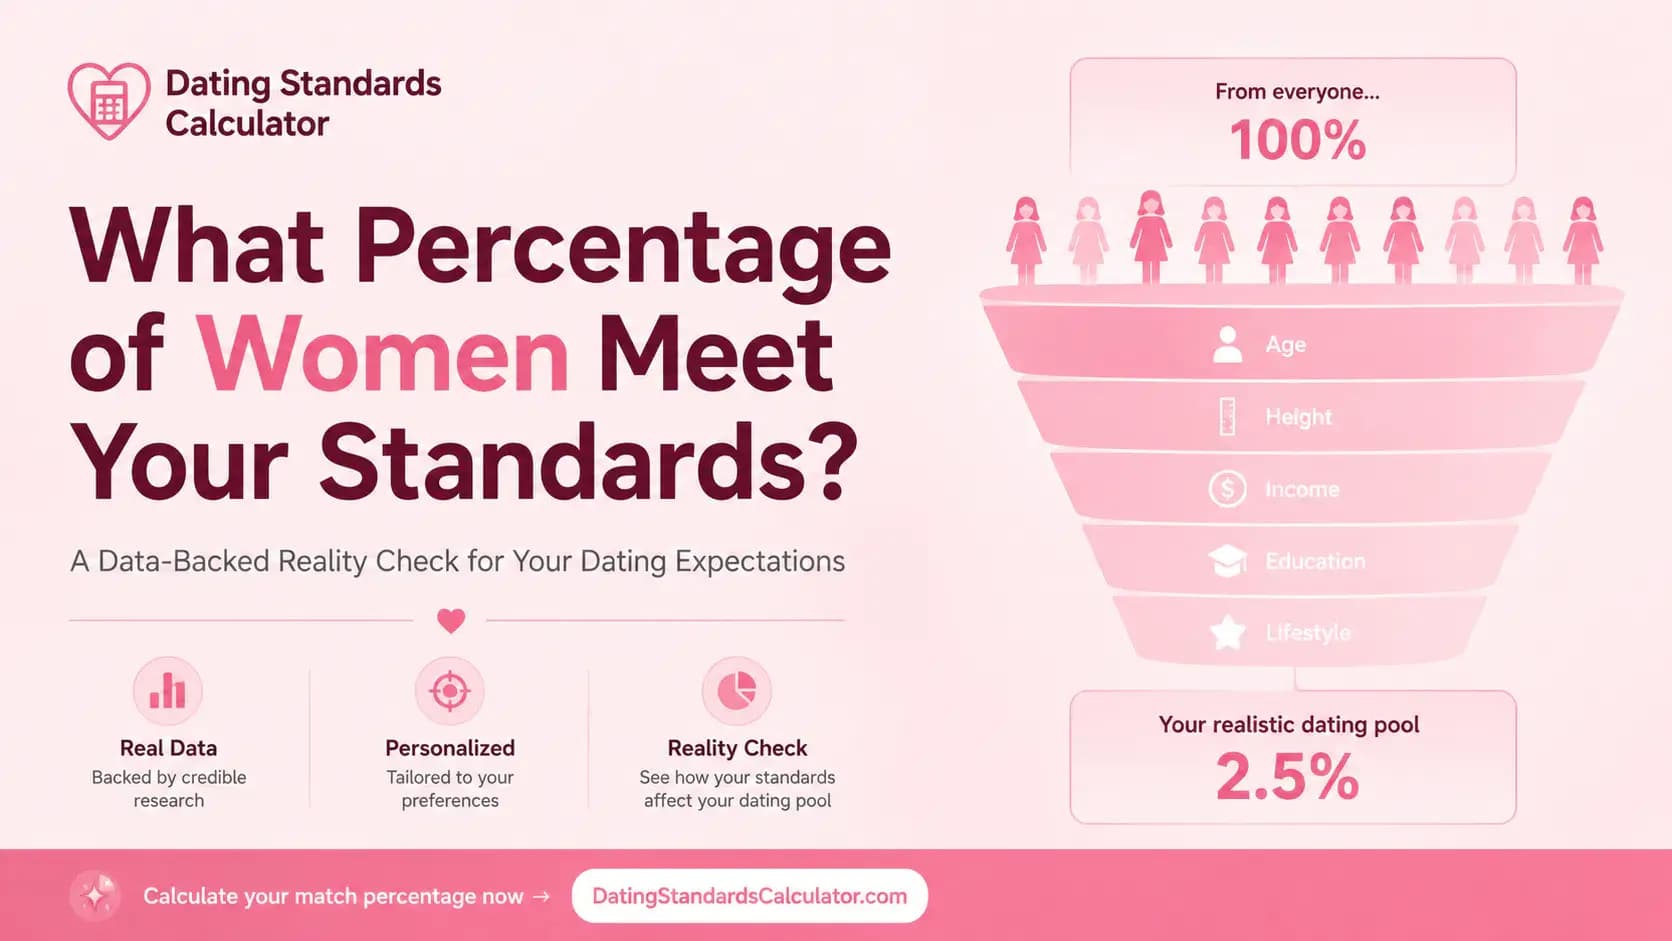
There is no single percentage that applies to everyone. Your result is the estimated overlap of the age, relationship status, height, income, education, and location filters you choose.
Use the women's standards test to calculate your own estimate, then read the percentage beside the population count and location. It measures demographic rarity—not mutual attraction or relationship success.
Estimate What Percent of Women MatchContents
If you have ever built a mental picture of your ideal partner, you may have wondered how many women actually fit it. The answer is rarely as simple as "10%" or "1 in 100," because your result depends on both the standards you choose and the population used for comparison.
A broad preference such as "women between 25 and 40" may leave a sizeable pool. Once you add relationship status, height, education, income, location, lifestyle, and family plans, the overlap can become much smaller. You can explore those trade-offs with the Female Partner Calculator, but the resulting percentage needs context before it becomes useful.
What Does the Percentage Actually Measure?
A dating-pool percentage estimates how many women in a defined reference population appear to meet your measurable criteria. In simplified terms, it divides the estimated number who match the selected filters by the number of women in the population being analyzed.
The denominator matters as much as the result. "Women in the United States," "unmarried women aged 25–34," and "women aged 25–34 who live within 50 miles" are three very different populations. A calculator that does not explain which population it starts with may produce an impressive-looking number that does not reflect your real dating environment.
The result is also not your probability of finding a partner. Demographic data cannot tell us which matching women are actively dating, attracted to your gender, interested in you, emotionally available, or looking for the same type of relationship. The percentage describes the rarity of a demographic combination, not your personal odds of forming a relationship.
For a broader explanation of percentages and population counts, read How Many People Meet Your Dating Standards?.
To see how the estimate is built and which assumptions are supported by data, read the calculator methodology and source notes. For location-specific context, compare the available country calculators.
Which Standards Reduce the Pool the Most?
Age and relationship status
Age usually defines the first meaningful boundary around a dating pool. A ten-year range naturally includes more women than a three-year range, but the effect also depends on where you live. A university town, a suburban county, and a large metropolitan area may have very different age distributions.
Relationship status adds another complication because "single" has no universal statistical definition. The U.S. Census Bureau’s ACS table B12002 breaks the population down by sex, age, and marital status, including categories such as never married, married, divorced, separated, and widowed. It does not show whether someone is currently in a relationship or actively looking for dates.
This distinction can materially change the estimate. Counting only never-married women produces a different pool from counting everyone who is not currently married, and neither group is identical to the population of available daters.
Height
Height can become a restrictive filter when the minimum is far from the population average. CDC data for August 2021 through August 2023 report an average measured height of 63.5 inches—about 5 feet 3.5 inches—for U.S. women aged 20 and older.
An average alone does not tell us how many women exceed a particular threshold, so a calculator needs a height distribution rather than one headline figure. Raising a minimum from 5 feet 4 inches to 5 feet 9 inches may reduce the pool far more than the five-inch difference suggests.
Height data also say nothing about age, marital status, location, or mutual attraction. The result is an estimate of how common the physical trait is, not how many matching women you can realistically meet.
Education and income
Education and income often appear together in dating preferences, but they should not be treated as interchangeable measures of ambition, intelligence, or financial stability.
The ACS provides educational-attainment data by sex and age through table B15001, while table S2001 reports earnings using defined worker populations and income categories. These sources are valuable because they make their categories visible, but the user still needs to distinguish individual earnings from household income and educational credentials from personal qualities.
A requirement such as "earns at least $100,000" may actually be standing in for a desire for financial responsibility or a compatible lifestyle. Those qualities also depend on debt, savings, career stability, spending habits, and local living costs. A salary threshold can estimate rarity, but it cannot fully measure financial compatibility.
Location
A national percentage is useful for understanding how unusual a combination is, but most people date locally. Even a relatively common profile may be difficult to find if the relevant population is small, geographically dispersed, or outside the places where you normally meet people.
Local estimates can be more practical, although narrower geographic groups often come with greater statistical uncertainty. The ACS publishes margins of error because its numbers are survey estimates rather than exact live counts; smaller or more specific populations should therefore be interpreted with extra caution.
Why You Cannot Just Multiply a Few Percentages
It is tempting to find separate percentages for age, height, income, education, and relationship status, then multiply them together. That approach looks logical, but it assumes the traits are independent.
In reality, many of them are related. Earnings vary with age, education, employment status, and geography. Marital status also changes substantially across age groups. If two traits commonly occur together, multiplying their isolated national percentages may underestimate the true overlap; in other cases, the shortcut may overestimate it.
A stronger calculation uses joint data wherever possible. Age and marital status, for example, can be analyzed together in one Census table. ACS Public Use Microdata Sample files also allow custom estimates across multiple compatible variables, although their geographic detail is limited and the records must be analyzed with the appropriate survey weights.
Height may still need to come from a separate CDC dataset, which introduces another modeling assumption. That does not make the estimate useless, but it does mean a result such as 2.37% should not be mistaken for an exact census of available women.
A More Honest Way to Estimate Your Match Percentage
Imagine that you are interested in women who are 27–35, not currently married, at least college educated, earning $60,000 or more, within a particular height range, and living in your metropolitan area.
A weak estimate would apply six unrelated national percentages. A more defensible approach would begin with women in the selected age group and location, combine age with marital status, use education and individual-earnings data from compatible populations, and then estimate the height requirement using measured CDC data. The final answer should be rounded and presented as a range rather than several exact-looking decimal places.
Even this improved result would still exclude some of the most important parts of dating. It cannot identify who is actively looking, who shares your values, who would be attracted to you, or whether the two of you would communicate well. Those limitations are not minor errors in the calculator; they are aspects of relationships that population statistics cannot measure.
How Should You Interpret a Low Result?
A low percentage means that your selected demographic combination is uncommon within the chosen population. It does not automatically mean that your standards are unreasonable.
One percent of a large metropolitan population may still represent thousands of women. Ten percent of a small and geographically inaccessible population may give you fewer realistic opportunities. The absolute count, location, and likelihood of actually meeting people all matter.
You should also look at which filter causes the biggest reduction. If widening the age range changes very little but lowering an income threshold expands the pool substantially, you have learned something useful about the structure of your preferences. The calculator works best as a comparison tool: change one condition at a time and observe how much the result moves.
The next question is whether that restrictive filter represents a genuine relationship need or a convenient proxy. A requirement connected to safety, respect, relationship intentions, or major life plans should not be abandoned simply to improve a score. A narrow height, degree, profession, or income cutoff may be more appropriate to reconsider when it does not reflect something essential.
To evaluate that distinction in more detail, read Are Your Dating Standards Too High?. If you are comparing standards for a male dating pool, see What Percentage of Men Meet Your Dating Standards?.
Frequently Asked Questions
What percentage of women should meet my standards?
There is no research-backed universal target. A useful result depends on the size and location of the underlying population, how frequently you meet new people, and whether your filters represent essential compatibility or optional preferences.
Does a 1% result mean my standards are unrealistic?
Not by itself. It means the measurable combination is uncommon in the calculator’s reference population. Whether it is workable depends on the approximate number of matching women, where they live, how flexible you are, and how much time you are comfortable spending on the search.
Does the percentage include women who would date me?
No. Public demographic data do not measure mutual attraction, sexual orientation, current dating activity, emotional availability, or individual preferences. The result estimates demographic prevalence rather than reciprocal interest.
Are dating standards calculators accurate?
They can provide a useful approximation when their sources, definitions, denominator, and assumptions are disclosed. Results become less reliable when unrelated percentages are multiplied together, national data are presented as local data, or several decimal places are used to imply certainty that the underlying sources do not support.
Bottom Line
There is no universal answer to "What percentage of women meet your dating standards?" Your result depends on how narrowly you define age, relationship status, height, education, income, and location—and on whether the calculator combines those variables responsibly.
Use the percentage to understand which preferences make your pool broader or narrower. Read it alongside the approximate population count and geographic scope, and remember that demographic rarity is not the same as relationship probability.
A calculator can help you examine your assumptions. It cannot decide which standards matter most, predict mutual attraction, or tell you whether a future relationship will work.
Methodology and Editorial Note
This article uses primary U.S. government sources for measurable demographic claims: the U.S. Census Bureau’s 2024 American Community Survey for age, marital status, education, earnings, and sampling uncertainty, and CDC/NCHS data for measured adult height.
No universal "good," "realistic," or "delusional" match percentage is presented because the cited demographic sources do not establish such a threshold. Public Census tables classify people using the categories collected by the survey and do not provide a complete measure of gender identity, dating activity, sexual orientation, mutual attraction, or relationship compatibility.
The article is intended to explain what a dating-pool estimate means and where its limitations begin. It is educational content, not individualized relationship or mental-health advice.